 30.
Canvas
30.
Canvas
Canvasとは
ブラウザで描画
CanvasはHTML5で導入され多機能で、ブラウザ上で動的なグラフィックやアニメーションを描画できます。
特徴
Canvasはゲーム、データの可視化、アート、シミレーションなど多くの場面で利用されます。JavaScriptプログラムして、2DだけでなくWebGLを用いた3Dグラフィック処理も実現できます。
canvasタグ
canvasタグは描画領域を提供するHTMLタグで、JavaScriptでグラフィックスを描画できます。Canvasに描画するにはプロパティやスタイルで幅・高さを指定する必要があります。
app.html
<canvas id="myCanvas" width="500" height="500"></canvas>
Context(コンテキスト)
Context(コンテキスト) は、Canvasに描画するためのインターフェース(API)のことです。
getContext()
getContext() で描画コンテキストを取得し、グラフィック描画の入口となります。関数の引数では2Dはたは3Dグラフィックを選択できます。
// 2D
const ctx = canvas.getContext('2d');
// 3D
const ctx = getContext("webgl")
メソッドとプロパティ
この ctx(コンテキストオブジェクト) を使って図形を描画や色設定のメソッドやプロパティが含まれています。
| 役割 | メソッド |
|---|---|
| パスの管理 | beginPath(), moveTo(), lineTo(), closePath() |
| 図形の描画 | stroke(), fill(), rect(), arc() |
| スタイル設定 | strokeStyle, fillStyle, lineWidth |
| テキスト描画 | fillText(), strokeText() |
| 画像の描画 | drawImage() |
| 変形・移動 | translate(), rotate(), scale() |
| クリア | clearRect() |
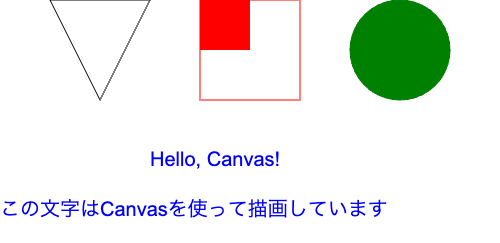
Canvasをはじめる
Canvasで簡単な図形や文字を描画してみます。
ファイル構成
basic/
├── app.html
└── js/
    └── app.js
app.html
<!DOCTYPE html>
<html lang="ja">

<head>
    <meta charset="UTF-8">
    <meta name="viewport" content="width=device-width, initial-scale=1">
    <title>Canvas</title>
    <!-- Tailwind CSS の CDN 読み込み -->
    <script src="https://cdn.tailwindcss.com"></script>
</head>

<body class="bg-gray-100 flex flex-col items-center justify-center min-h-screen">
    <!-- タイトル -->
    <h1 class="text-3xl font-bold mb-6">Canvas</h1>

    <!-- Canvas 要素 -->
    <canvas id="myCanvas" width="500" height="300" class="border border-gray-300 bg-white" ></canvas>

    <script src="js/canvas.js"></script>
</body>

</html>
app.html
<canvas id="myCanvas" width="500" height="500" class="p-6 bg-white"></canvas>
2Dコンテキスト取得
id=myCanvas でcanvasを取得し、2D描画用のコンテキストを取得します。
js/app.js
const canvas = document.getElementById('myCanvas');
const ctx = canvas.getContext('2d');
四角形
fillRect() , strokeRect() などで四角形を描画します。
js/app.js
function drawSquare() {
    ctx.fillStyle = 'red';      // 図形の塗りつぶしの色を赤に設定
    ctx.strokeStyle = 'red';    // 図形の枠線の色を赤に設定
    ctx.fillRect(200, 0, 100, 100);  // (200, 0) の位置に 100×100 の赤い四角を描画
    ctx.strokeRect(200, 0, 100, 100); // (200, 0) の位置に 100×100 の赤い枠線を描画
}
三角形
線を描画する前に、まず beginPath() で新しいパスを開始し、closePath() でパスを閉じます。
js/app.js
function drawTriangle() {
    ctx.beginPath();                // 新しいパスを開始

    ctx.closePath();                // パスを閉じる
}
moveTo() で点を設定し、lineTo() で直線を描画します。
js/app.js
function drawTriangle() {
    ctx.beginPath();                // 新しいパスを開始
    ctx.moveTo(50, 0);              // (50, 0) に移動(三角形の頂点)
    ctx.lineTo(150, 0);             // (150, 0) に線を引く(右上へ)
    ctx.lineTo(100, 100);           // (100, 100) に線を引く(下中央へ)
    ctx.closePath();                // パスを閉じる(最初の点 (50, 0) へ戻る)
    ctx.stroke();                   // 三角形の外枠を描画
}
円
arc() で円を描画します。
js/app.js
function drawCircle() {
    ctx.fillStyle = 'green';      // 塗りつぶしの色を緑 ('green') に設定
    ctx.strokeStyle = 'green';    // 枠線の色を緑 ('green') に設定
    ctx.beginPath();              // 新しいパス(描画開始)を設定
    ctx.arc(400, 50, 50, 0, Math.PI * 2);  // 円の描画
    ctx.closePath();              // パスを閉じる(省略可能)
    ctx.fill();                   // 円を塗りつぶし
    ctx.stroke();                 // 円の枠線を描画
}
テキスト描画
メソッド・プロパティ
| 項目 | 説明 |
|---|---|
| ctx.fillText(text, x, y) | テキストの状態設定(フォント、塗りつぶし色、座標) |
| ctx.font | テキストのフォント |
| ctx.textAlign | テキストの水平方向の配置 |
| ctx.textBaseline | テキストの垂直方向の基準位置 |
パラメーター
| パラメータ | 説明 |
|---|---|
| left | 左寄せ |
| right | 右寄せ |
| center | 中央寄せ |
| hanging | ハンギングベースラインを基準 |
| middle | テキストの中央を基準 |
| alphabetic | 標準的なアルファベットのベースラインを基準 |
| ideographic | 漢字、ひらがな、カタカナなどの文字に適用される基準 |
| bottom | テキストの最下部を基準 |
js/app.js
function drawTextOnCanvas(text, x, y, font, color) {
    ctx.font = font;
    ctx.fillStyle = color;
    ctx.textAlign = 'left';
    ctx.textBaseline = 'top';
    ctx.fillText(text, x, y);
}
ペイントアプリ
canvasタグを使ってシンプルな描画アプリを作成します。マウスやタッチ操作で描画し、色の変更、線の太さの変更、リセット、画像のダウンロードします。
ファイル構成
paint/
├── app.html
└── js/
    └── app.js
app.html
<!DOCTYPE html>
<html lang="ja">
<head>
    <meta charset="UTF-8">
    <meta name="viewport" content="width=device-width, initial-scale=1">
    <title>Canvas 描画チュートリアル</title>
    <!-- Tailwind CSS の CDN 読み込み -->
    <script src="https://cdn.tailwindcss.com"></script>
</head>
<body class="bg-gray-100 flex flex-col items-center p-4">
    <h1 class="text-3xl font-bold mt-4 mb-6">Canvas 描画チュートリアル</h1>
    <p class="mb-4 text-gray-700">マウスまたはタッチで描画し、色や線の太さを変更、キャンバスをリセット、または PNG でダウンロードできます。</p>

    <!-- コントロール群 -->
    <div class="mb-4 flex flex-col sm:flex-row gap-4 items-center">
        <!-- 線の色 -->

        <!-- 線の太さ -->

        <!-- リセット -->
        <button id="resetButton" class="bg-red-500 text-white px-4 py-2 rounded hover:bg-red-600">リセット</button>
        <!-- PNGダウンロード -->
        <button id="downloadButton" class="bg-green-500 text-white px-4 py-2 rounded hover:bg-green-600">PNG ダウンロード</button>
    </div>

    <!-- Canvas 要素 -->
    <canvas id="drawCanvas" class="border border-gray-300 bg-white shadow-lg" width="600" height="400"></canvas>

    <!-- JavaScript 読み込み -->
    <script src="js/app.js"></script>
</body>
</html>
js/app.js
// DOM 要素取得
const colorPicker = document.getElementById('colorPicker');
const lineWidthRange = document.getElementById('lineWidth');
const lineWidthValue = document.getElementById('lineWidthValue');
const resetButton = document.getElementById('resetButton');
const downloadButton = document.getElementById('downloadButton');
const canvas = document.getElementById('drawCanvas');
const ctx = canvas.getContext('2d');

// 描画状態管理
let isDrawing = false;
let lastX = 0, lastY = 0;
let currentColor = '#3490dc';
let currentLineWidth = 3;
描画設定
色の変更
type="color" はカラーピッカーで、好きな色を選択できます。
app.html
<div class="flex items-center gap-2">
  <label for="colorPicker" class="font-medium">色:</label>
  <input type="color" id="colorPicker" value="#3490dc" class="border border-gray-300 rounded p-1">
</div>
選択した色はcolorPicker の value プロパティで取得し、currentColor を更新します。
js/app.js
colorPicker.addEventListener('change', (e) => currentColor = e.target.value);
線の太さの変更
type="range" はスライダーで、したい範囲で線の太さを調整します。
app.html
<div class="flex items-center gap-2">
  <label for="lineWidth" class="font-medium">線の太さ:</label>
  <input type="range" id="lineWidth" min="1" max="10" value="3" class="w-32">
  <span id="lineWidthValue" class="w-6 text-center">3</span>
</div>
スライダーの値が変わると、currentLineWidth を更新します。
js/app.js
lineWidthRange.addEventListener('input', (e) => {
    currentLineWidth = e.target.value;
    lineWidthValue.textContent = currentLineWidth;
});
描画開始
mousedownイベント
mousedownイベント が発生するとgetBoundingClientRect() でマウス座標を取得します。マウスの現在位置をキャンバス内の座標に変換してstartDrawing() に受け渡します。
canvas.addEventListener('mousedown', (e) => {
    const rect = canvas.getBoundingClientRect();
    startDrawing(e.clientX - rect.left, e.clientY - rect.top);
});
isDrawing = true で描画開始フラグを有効にし、最新の座標を更新します。
function startDrawing(x, y) {
    isDrawing = true;
    [lastX, lastY] = [x, y];
}
touchstartイベント
スマホ・タブレットのようなタッチイベントは touchstart で処理します。
js/app.js
canvas.addEventListener('touchstart', (e) => {
    const rect = canvas.getBoundingClientRect();
    const touch = e.touches[0];
    startDrawing(touch.clientX - rect.left, touch.clientY - rect.top);
    e.preventDefault();
});
描画移動
mousemoveイベント
mousemoveイベント が発生するとgetBoundingClientRect() でマウス座標を取得します。キャンバス内の座標に変換して、draw() で描画します。
js/app.js
canvas.addEventListener('mousemove', (e) => {
    const rect = canvas.getBoundingClientRect();
    draw(e.clientX - rect.left, e.clientY - rect.top);
});
touchmoveイベント
スマホ・タブレットのようなタッチイベントは touchmove で処理します。
js/app.js
canvas.addEventListener('touchmove', (e) => {
    const rect = canvas.getBoundingClientRect();
    const touch = e.touches[0];
    draw(touch.clientX - rect.left, touch.clientY - rect.top);
    e.preventDefault();
});
描画処理
draw() で指定した座標でキャンパスの描画をします。
js/app.js
// 描画処理
function draw(x, y) {
    if (!isDrawing) return;
    ctx.beginPath();
    ctx.moveTo(lastX, lastY);
    ctx.lineTo(x, y);
    ctx.strokeStyle = currentColor;
    ctx.lineWidth = currentLineWidth;
    ctx.stroke();
    [lastX, lastY] = [x, y];
}
描画終了
isDrawing を false に設定し、描画中を描画を終了します。
js/app.js
function endDrawing() {
    isDrawing = false;
}
mouseup と mouseoutイベントで、描画を終了します。
js/app.js
// マウスイベント
canvas.addEventListener('mouseup', endDrawing);
canvas.addEventListener('mouseout', endDrawing);

// タッチイベント
canvas.addEventListener('touchend', endDrawing);
canvas.addEventListener('touchcancel', endDrawing);
- mouseup: ユーザーがマウスボタンを離したとき
- mouseout: ユーザーがキャンバス外にマウスを移動したとき
リセット
clearRect() でキャンバス全体を指定して描画を削除します。
js/app.js
resetButton.addEventListener('click', () => {
    // キャンバス全体をクリア
    ctx.clearRect(0, 0, canvas.width, canvas.height);
});
ダウンロード
toDataURL() でPNG画像に変換します。ダウンロードは aタグを一時的に作成してclickイベントを実行してダウンロードします。
// ダウンロードボタンクリック
downloadButton.addEventListener('click', () => {
    // Canvas の内容を PNG のデータURL に変換
    const dataURL = canvas.toDataURL('image/png');

    // 一時的なリンク(aタグ)を生成してクリックし、ダウンロードを実行
    const a = document.createElement('a');
    a.href = dataURL;
    a.download = 'canvas.png';
    document.body.appendChild(a);
    a.click();
    document.body.removeChild(a);
});
トレイル
js/Dot.js
// ドット(パーティクル)を表現するクラス
class Dot {

    constructor() {
        // キャンバス内のランダムな初期位置
        this.x = Math.random() * w;
        this.y = Math.random() * h;

        // 半径は 1~4px 程度
        this.radius = Math.random() * 3 + 1;

        // X, Y 方向の速度(-1~1)
        this.vx = Math.random() * 2 - 1;
        this.vy = Math.random() * 2 - 1;

        this.color = `hsl(${Math.random() * 360}, 100%, 50%)`;
    }

    update() {
        this.x += this.vx;
        this.y += this.vy;

        // キャンバスの端で跳ね返る処理
        if (this.x < 0 || this.x > w) this.vx *= -1;
        if (this.y < 0 || this.y > h) this.vy *= -1;
    }

    draw() {
        ctx.beginPath();
        ctx.arc(this.x, this.y, this.radius, 0, Math.PI * 2);
        ctx.fillStyle = this.color;
        ctx.fill();
    }
}
js/app.js
// Canvas とコンテキストの取得
const canvas = document.getElementById('canvas');
const ctx = canvas.getContext('2d');

// キャンバスサイズ
let w = canvas.width = window.innerWidth;
let h = canvas.height = window.innerHeight;

// 複数のドットを格納する配列
const dots = [];
// ドットの数(必要に応じて調整可能)
const numDots = 200;
// 距離制限
const distanceLimit = 100;

function createDots() {
    for (let i = 0; i < numDots; i++) {
        const dot = new Dot();
        dots.push(dot);
    }
}

function animate() {
    // トレイル効果
    // 各フレームで、完全に消去せずに半透明の黒で上書きする
    ctx.fillStyle = 'rgba(0, 0, 0, 0.1)';
    ctx.fillRect(0, 0, w, h);

    // 各ドットの更新と描画
    for (const dot of dots) {
        dot.update();
        dot.draw();
    }

    // 各ドットの間の線を描画
    for (let i = 0; i < dots.length; i++) {
        for (let j = i + 1; j < dots.length; j++) {
            // 座標計算
            const deltaX = dots[i].x - dots[j].x;
            const deltaY = dots[i].y - dots[j].y;
            // 距離を計算
            const distance = Math.sqrt(deltaX * deltaX + deltaY * deltaY);

            // 距離が100未満なら線を描画
            if (distance < distanceLimit) {
                // 透明度を動的に設定
                ctx.strokeStyle = `rgba(255, 255, 255, ${1 - distance / 100})`;
                // 太さを設定
                ctx.lineWidth = 0.5;
                ctx.beginPath();
                // 線を描画
                ctx.moveTo(dots[i].x, dots[i].y);
                ctx.lineTo(dots[j].x, dots[j].y);
                ctx.stroke();
            }
        }
    }

    // 次のフレームをリクエスト
    requestAnimationFrame(animate);
}

// リサイズイベント
window.addEventListener('resize', () => {
    w = canvas.width = window.innerWidth;
    h = canvas.height = window.innerHeight;
});

// ドットの生成
createDots();
// アニメーション開始
animate();